Tableau has a super useful “Show Me” function which allows you to choose from 24 chart types based on dimensions and measures you select. This is a brilliant feature for beginners. However, what if you’re a little bit more experienced and want to know how to make these charts from scratch? Or even if you’re a beginner who doesn’t want a shortcut? In this four-part series, I will go through how to create all 24 “Show Me” chart types.
For this series, I will be using the “EU Superstore” dataset found in My Tableau Repository. In this post, I will go through how to create a text table, heat map, highlight table, symbol map, filled map and pie chart.
Let’s get started!
Text Table
Text tables are exactly like they sound. A table of values similar to what you get in an Excel spreadsheet. For this text table, I would like to look at how much each sub-category of products have made in sales.
Step One
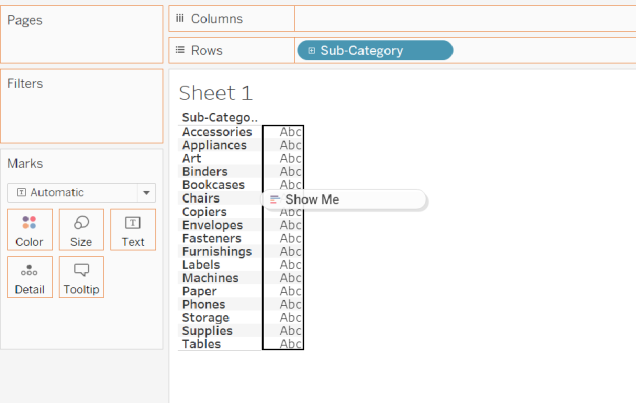
From the Data Pane, drag over the dimension “Sub-Category” over to the Rows Shelf (Figure 1).
