The Best of DS11

This week is DS11’s last week of training. Next week, we’ll all be split up and sent to our placements for the next 6 months. We probably won’t all be back together for a while so I’ve been feeling quite reflective. Throughout the past 4 months, we have done some amazing work and in this post, I would like to highlight the vizzes and blogs that are personally my favourite. DS11 has produced so much useful and incredible content over the past few months and this post can’t possibly cover it all so be sure to check out our Twitters and Tableau Public profiles.


Meet us!


Favourite Viz : One

How could I have a favourite viz section and not include this beautiful viz by Ellie. This viz was done for Dashboard Week Day 1 and deservedly got Viz of the Day! Check it out here. Isn’t the snow incredible?!

Ellie’s VOTD!
Click to keep reading!

The Prep Off: Alteryx vs Tableau Prep Round 2


Two major contenders in the ring tonight: new but developing at light speed, Tableau Prep and tried and trusted, Alteryx Designer.

Who will win this time after a draw in the last Prep Off? Watch the replay of Round 1 here.

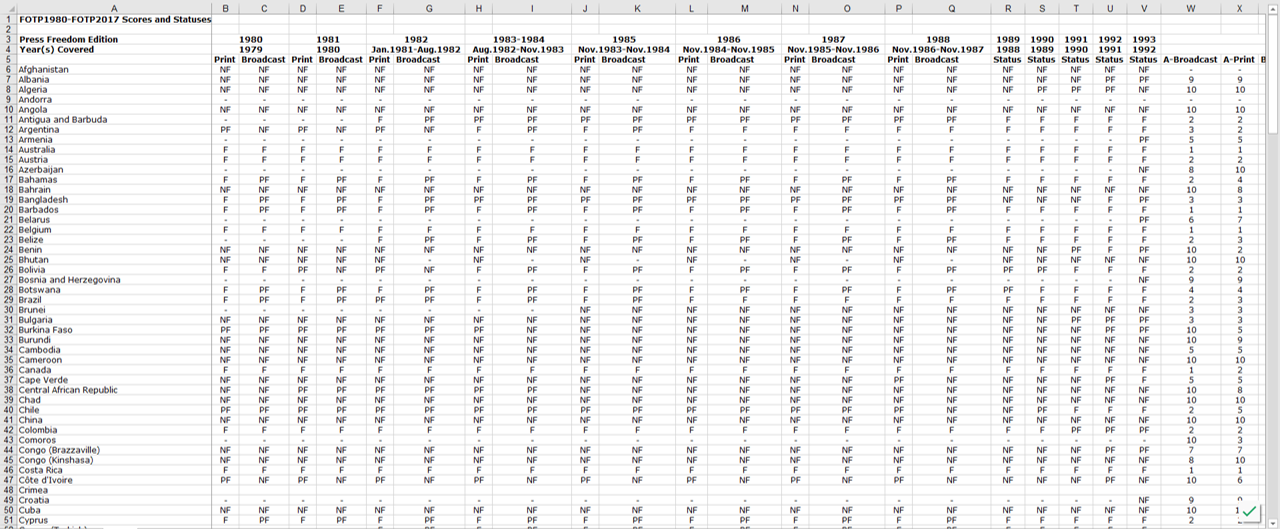
How do these two softwares compare when cleaning an Excel spreadsheet with 182 fields? The chosen data features the table seen in Figure 1. This data was used in Makeover Monday Week 2 2019 (after it was cleaned, of course). Download the Excel file (Freedom of the Press) and follow along with me. 


Fig 1. Original Excel spreadsheet. Years go from 1979-2016


Ready? Fight!

Click to keep reading!

Why You Should Apply For The Data School

Now that DS11 are approaching the end of our 4 months of training at the Data School and will soon be shipped off to our first of 4 placements, I have been reflecting on the experience and would like to convince you to apply for the Data School too.


Because it’s an amazing opportunity

Where do I start with this one? A salary of 30k in year one, rising to 35k in year two. That alone is a reason many would want this job but it’s so much more than the pay. You will be taught for four months (paid) by the best in the business. The Information Lab is home to 4 Tableau Zen Masters and 2 Alteryx Aces as well as so many of the brightest in the community. The wealth of knowledge and experience that you will have access to is something enviable for many. The Data School is an opportunity to learn and kickstart your career. By the time your 2.5 years are up, you will have worked at 5 different companies (incl. The Information Lab) and worked with many more clients while you were in training. There is no question that you will be qualified for some amazing jobs afterwards. In fact, if you have taken advantage of the opportunities presented to you in the 2.5 years, you will likely have a choice of jobs to go to.


Click to keep reading!

Organising your Tableau Data Pane for Bliss and Harmony

Today DS11 and DS12 were treated to a talk from Simon Beaumont about data architecture, enabling customers to understand your dashboards, how to make your workbooks easy for others to pick up and more. In this post, I will go over a few things about organising your Tableau workbook Data Pane to make it easier for others to understand.


Why organise your Data Pane?

If you are working in an organisation with multiple analysts and/or people who you will hand over workbooks to, you want them to be able to understand your workbook quickly. It is better to avoid future analysts having to spend hours picking your workbook apart to understand what a calculation does or what this set is used for, etc…

Also, if you publish your work to Tableau Public, you might want to make the workbook easy to understand in case someone downloads it to learn a technique you demonstrated.

Additionally, it may help you later down the line. If you have to refer back to an old workbook and realise you don’t understand how you got to what you did, that would be a pain.

As you can see, there are numerous reasons why one should organise their Data Pane.


Click to keep reading!

How to Prepare for your Alteryx Designer Core Exam

This month, many of DS11 are taking the Alteryx Designer Core Exam (as well as the Tableau QA), including myself. If you’re interested in my top tips on how to pass the Tableau QA, see my post here.


In this post, I will go through:

  1. The resources I found helpful while preparing for the exam
  2. My experience of taking the exam
  3. My top tips for passing!


Click to keep reading!

How to Teach Tableau/Alteryx

Last month, DS11 taught the public Tableau and Alteryx and this month, we are conducting webinars teaching the same content. Check out our meetup page for more details on upcoming webinars and events!

For both of these lessons, I taught Alteryx Data Prep. If you missed my webinar, it was recorded and will be uploaded so I will update this post with a link later.

In this blog post, I will go over my teaching experience and some top tips from myself and from the beautiful people at the Information Lab.


My Teaching Experience and Top Tips!

Fig 1. DS11’s Alteryx Training Day


To prepare for teaching, I sought advice from the wealth of experience of the Information Lab consultants. The advice I received was super useful and helped me to prepare my lesson plan. Figure 2 below shows all the teaching tips I gathered categorised into four sections.


Click to keep reading!

Tableau Tip: Watch Out for Misleading Average Lines!

Tableau’s Analytics pane allows you to slap an average line onto your view. Drag, drop, done?

Not quite. In this blog, I will show you an example of when the average line Tableau creates for you may not be doing what you think it does.


Let’s start

So Figure 1 below shows a vertical bar chart with the height of each bar indicating the number of customers that fall into each number of orders bucket. For example, 134 customers have ordered 5 times; 1 customer has ordered 17 times.


Fig 1. A vertical bar chart showing how many orders customers have


Click to keep reading!

Louise’s 2018 in Data

This time last year, I was a final year Medical Engineering student without a clear career path. Now, I’ve graduated and I have a job that I love – more than I expected to have by this time!

Fig 1. My greatest accomplishments in 2018


2018 has been an amazing year and I’d like to take a moment to say I am so thankful for my family and friends for supporting me throughout and to everyone at the Data School and the wider data community for welcoming me. Now, on to a recap of the year…


Click to keep reading!