Did you know you can make your own colour palettes for Tableau? This is great for businesses and individuals who want to incorporate branding into your dashboards and to ensure regularity of colour in dashboards across your company.
So, how do you make one?
Navigate to ‘My Tableau Repository’ on your computer and open the Preferences.tps file in a text editor of your choice.
If you have never added any custom colour palettes before, your preferences file will likely look similar to Figure 1.
Fig 1. Preferences file with no custom palettes in a text editor
Two major contenders in the ring tonight: new kid on the block, Tableau Prep and reigning champion here at the Information Lab, Alteryx Designer.
How do these two softwares compare when cleaning two Excel sheets (within the same workbook)? The chosen data features the table seen in Figure 1. The data includes merged cells, totals, unnecessary content, dates in a row and times in a column, plus its in German! Download the Excel file (2018-09-18 Hamburg) and follow along with me.
Fig 1. Original Excel spreadsheet sample with red boxes indicating the removable content
As cliché as it is, time really has flown by. The Data School’s 11th cohort have just completed our 6th week of training and will be beginning our 7th week at the time of this post’s publishing. Crazy right?
With only a couple weeks left until the halfway point of our 4 months of training, I thought I’d reflect on how things have gone so far, major lessons I’ve learned, and what I want to do to make the most of my remaining training time.
What I have done so far, in numbers.
6 weeks of Tableau and Alteryx training
6 presentations
2 client projects
1 client project as project manager
9 blog posts published on the Data School blog (or 10 including this one!)
1 domain purchased for my personal website (here!)
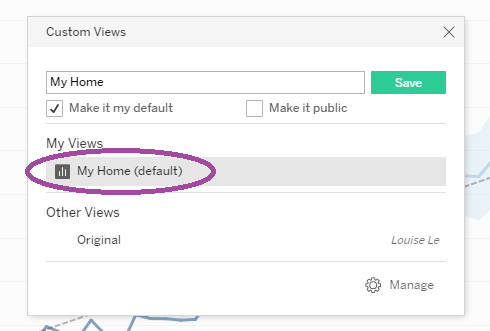
Among the many things we learned during our first official Tableau Server lesson with Jonathan MacDonald, we learned the importance of an often underutilised Server feature, custom view.
In this post, I will go over what custom views are, why they’re super useful aaand hopefully by the end of this post convince you to use them more!
What are Custom Views?
Custom views are like they sound. They are snapshots of a dashboard or sheet that you, the user, choose and save for quick future reference. Custom views are especially useful for dashboards or sheets that have lots of filters and drilling down.
NOTE (edit 10/11/18): Custom views can only be created by those with an Explorer license, but created custom views can be viewed by those with Viewer licenses. Thank you Chris Love for this info!
Let’s try an example. I will be using my UK House Prices viz (data source: Exasol) which I have uploaded onto Server.
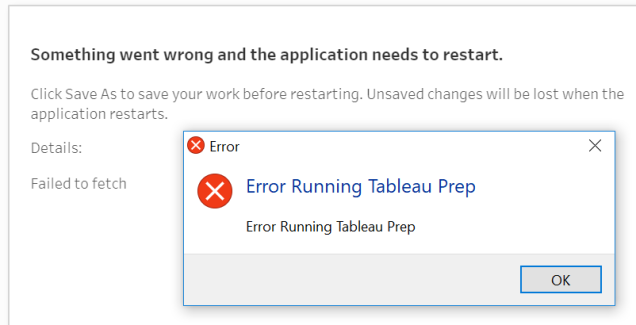
Since my last blog, I have used Tableau Prep 2018.2 to clean five different datasets so I think it’s a good time to discuss the good, the bad and the ugly of Prep…
The Good
As with Tableau Desktop, Prep is pretty. Compared to Alteryx, it looks modern, clean and is just overall, aesthetically pleasing. The user interface is friendly and intuitive. Who doesn’t love a good ol’ drag and drop? I mean, we love Tableau Desktop right?
Unlike Alteryx, Prep lets you actually interact with your data as you would in Desktop. I personally love being able to do this.
Tableau Prep has some great built-in features for data cleansing. It’s easy as pie to split fields as you would in Alteryx with Text to Columns. It’s easy to remove whitespace and change the case of your fields (note: you can only change the case of the whole string, not title cases).
Another super useful function is the Pronunciation Group and Replace. Take a look at Figure 1, you can see that ‘Growlith’ should be spelt like ‘Growlithe’. You could click on ‘Growlith’ and type the ‘e’ manually or… you could use Pronunciation as seen in Figure 1. Doing this groups the two terms together under ‘Growlithe’ (denoted by the paperclip icon).
Figure 1. Demonstration of Pronunciation Group and Replace
Amazing right? Yes, but there are limitations. This segways us nicely into…