Tableau Prep version 2018.1.1 was released in April this year. Six months on and five versions later, Emily Chen introduced DS11 to Tableau Prep 2018.3.1.
My first thoughts? Its user interface is modern and intuitive with some great functions but there are some limitations. Tableau Prep won’t surpass Alteryx in power at the moment but definitely has potential!
Being a new software, many of you probably haven’t given it a go yet. In this guide, I will run through everything you need to know to get started! See my previous posts on getting started with Alteryx (link) and Tableau Public/Desktop (link).
Now, if you haven’t got Tableau Prep downloaded yet, you can get the free trial here. Otherwise, start up Prep and let’s get started!
Start Screen
The first thing you’ll see when you start up Tableau Prep is something like Figure 1.
Tableau has a super useful “Show Me” function which allows you to choose from 24 chart types based on dimensions and measures you select. This is a brilliant feature for beginners. However, what if you’re a little bit more experienced and want to know how to make these charts from scratch? Or even if you’re a beginner who doesn’t want a shortcut? In this four-part series, I will go through how to create all 24 “Show Me” chart types.
For this series, I will be using the “EU Superstore” dataset found in My Tableau Repository. In this post, I will go through how to create a text table, heat map, highlight table, symbol map, filled map and pie chart.
Let’s get started!
Text Table
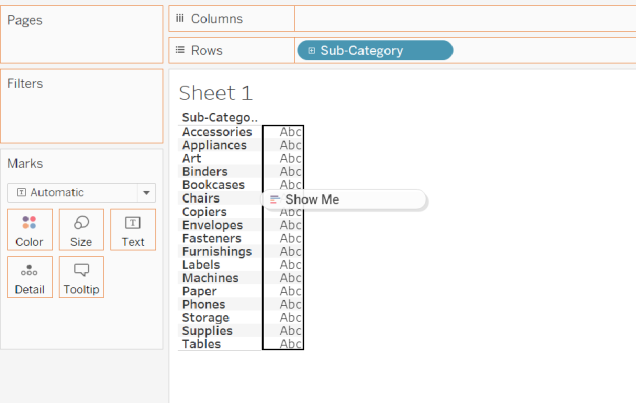
Text tables are exactly like they sound. A table of values similar to what you get in an Excel spreadsheet. For this text table, I would like to look at how much each sub-category of products have made in sales.
Step One
From the Data Pane, drag over the dimension “Sub-Category” over to the Rows Shelf (Figure 1).
We are currently well into our second week of the Data School; with the focus of this week being Tableau (i.e. the reason we all applied to this job). For all of you who are interested in learning to use Tableau and/or are thinking of applying to the Data School but don’t know where to begin, this blog post will take you through everything you need to know to get you started. See my previous post on getting started with Alteryx (link).
First of all, check out Tableau’s Starter Kit (link here). It’s a great resource for getting started. Remember, the more you read, the more you learn!
Now, if you haven’t already downloaded Tableau Public for free, here’s a link to where you can sign up. If you have access and would prefer to use Tableau Desktop’s free trial, then go ahead and start it up!
*Warning* I will be dropping a lot of terminology, so get ready. However, don’t worry about memorising the terms as much as understanding the purpose/function.
Start Screen
The first thing you’ll see when you open up (in my case) Tableau Desktop, is something like Figure 1.
DS11’s first week at the Data School was focused on introducing us to Alteryx; a super useful software for prepping messy data before visualising in Tableau. Amongst data preparation, Alteryx is also capable of spatial and predictive uses. In this guide, we will navigate through the interface of Alteryx Designer and I will also give some helpful hints on how to get started. Now, download Alteryx Designer and let’s get acquainted.
Alteryx Designer Interface
When opening Alteryx Designer, you will be met with an interface that looks like Figure 1. Matlab users out there will be very familiar with this layout!