Tips for Speeding Up Slow Tableau Dashboads

The dashboard is taking ages to load. Rubbish!

– Joe “End-user” Bloggs

Heard this before? I know I have. So how do we speed up our dashboards? In this blog, I’ll share a few tips on how you can optimise your Tableau dashboards for speed and performance. Some of these tips, I’ve picked up from experience, colleagues or through Google searches. One particularly useful resource has been this whitepaper. I recommend it as further reading.

Data Optimisation

1. To extract, or not to extract?

In some scenarios, it would be more performant to extract your data, while in others it would be better to keep a live connection.

In these situations, an extract would be better:

  • If your existing live query is slow, then it’s a good idea to try switching over to extract. The live query could be slow because Tableau is taking long to query the database. Perhaps your data warehouse is located halfway around the world; it would take longer to query this data than if it were in the next room, or, in the form of an extract on your local machine.
  • If you would like to do offline building, you would need to extract your data. This may allow you to analyse your data faster and then you can switch back to a live connection when you’re done.
  • If your data doesn’t require a complete refresh, for example, where existing rows do not change but new rows are added periodically, it may be preferable to use an extract and incremental refresh schedule. This would be less load on your server than doing a full refresh every time.

In these situations, a live connection would be better:

  • When you need access to real-time data. For example, if you want a transaction to appear as soon as it happens, then a live connection would be better. With extracts, a refresh schedule would have to be set-up for at most, every 15 minutes. You cannot set a refresh more often than this, so if you require data refreshes more often, they a live connection is better.
  • If your data has many, many rows (millions or billions), then a live connection is better. Firstly, it would take a very long time to generate the extract. Secondly, it would be a greater load on Tableau.

2. Tableau joins > Custom SQL joins

While Custom SQL queries can be very powerful, the queries generated by Tableau’s joins will often be more efficient that writing your own join scripts.

3. Initial SQL > Custom SQL

When using a Custom SQL query, Tableau re-queries the database each time a change is made to the visualisation. However, with Initial SQL, the database is only queried once when the workbook is opened. This temporary table can then be referenced using a custom SQL query.

Efficient Calculations

1. All data types are not created equal

Different data types have different speeds to process.

Fastest
Boolean
Number
String
Slowest

As booleans are fastest, where possible, write calculations that generate booleans. Here is an example of the same calculation but producing different data types:

[Sales]=[Target] will return a T/F boolean
IF [Sales]=[Target] THEN 1 ELSE 0 END will return numbers
IF [Sales]=[Target] THEN ‘Yes’ ELSE ‘No’ END will return strings

This applies to parameters too! It is better to use numbers as the ‘Value’ and then configure the ‘Display As’ option for the string you actually want. This way, Tableau will use the faster number to compute.

2. What IF there’s a better way?

There are a surprising number of ways you can write better IF statements. First, instead of nesting IF statements in other IF statements, utilise ELSEIF.
For example:

Nested: IF [Sales]=[Target] THEN ‘Yes’ ELSE (IF [Sales]<[Target] THEN ‘No’ END) END
Not nested: IF [Sales]=[Target] THEN ‘Yes’ ELSEIF [Sales]<[Target] THEN ‘No’ END

You know what’s better than an IF statement? A CASE statement.

CASE [Category]
WHEN ‘Furniture’ THEN 1
WHEN ‘Office Supplies’ THEN 2
WHEN ‘Technology’ THEN 3
END

So why is this faster? Well if you were to write this same calculation as an IF statement, Tableau would have to call the field ‘Category’ multiple times, whereas with a CASE statement, ‘Category’ is only called once.

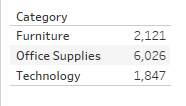
You can optimise this CASE statement even further! Firstly, avoid redundant conditions. As you may have noticed, I didn’t need to write the last ‘Technology’ line. This is because Sample – Superstore only has 3 categories. So if it’s not ‘Furniture’ or ‘Office Supplies’, then it’s obviously ‘Technology’. This applies to IF statements too.

CASE [Category]
WHEN ‘Furniture’ THEN 1
WHEN ‘Office Supplies’ THEN 2
ELSE 3
END

Even better still, sort your CASE statement by the number of rows each condition meets. Because Tableau runs all rows through the first condition first, then whatever doesn’t meet that condition, passes through the next condition, and so on. So we want to reduce the number of rows that passes onto the next condition, because it’ll be less work for Tableau. In our example, we sell mostly ‘Office Supplies’, so we should place that condition first. Then, ‘Furniture’, then ‘Technology.

CASE [Category]
WHEN ‘Office Supplies’ THEN 1
WHEN ‘Furniture’ THEN 2
ELSE 3
END

3. Don’t reinvent the wheel! Use Tableau’s native features

Most times, it is more performant to use Tableau’s native features instead of using calculated fields to recreate them. The features I mean are aliases, groups, sets, bins, etc… If you don’t need a calculated field, use the native features.

4. COUNTD is hella slow

If COUNT would suffice, use COUNT. COUNTD is one of the slowest aggregations for Tableau, so don’t use it unless you have to.

5. Limit the number of calculated fields

Every field is a field Tableau has to query and calculate. Remember to remove all calculations that aren’t being used or using the Hide Unused Fields feature to hide fields that aren’t being used. This does not remove it from your workbook but hides them so that Tableau doesn’t query it. Try to keep calculated fields under 100 per workbook.

6. Compute row-level calculations in the database

Tableau is great at aggregations. Row-level calculations that don’t need to be performed in Tableau, should be pre-calculated in the database or in an ETL process if performance is a concern. This takes some load off of Tableau and lets Tableau do what it does best.

Fast Filters

1. Context filters

Filters on the filters shelf are independent of each other. When a filter is added to context, all other filters are dependent on what data comes out of the context filter. This means that Tableau has to compute the context filter, create a temporary table and then query that table for the other filters. This can be quite intensive so try not to use context filters excessively. If context filters could be a data source filter instead, then use that.

2. Data source filters

As previously, if a context filter could be a data source filter, use a data source filter. Data source filters generate subqueries, rather than temporary tables, so they are more efficient than context filters. Another reason to use a data source filter could be to reduce the number of rows that Tableau has to query in the visualisation and therefore reduce the load.

3. Quick filters aren’t quick!

Despite the misleading name, quick filters aren’t necessarily quick. Tableau pre-computes all potential values of all quick filters when a dashboard is opened. This could mean it takes ages to load. So if your dashboard has tonnes of quick filters, try to use actions instead. Drill-downs or filter actions are a great option to both speed up your dashboard, but to also encourage your user to interact. Alternatively use a parameter as your selection interface and apply a filter for that parameter.

4. (Don’t) Show only relevant values

This feature can be very useful for preventing users from selecting options that they shouldn’t. However, they’re not very efficient. This is because they rely on other filters on the dashboard. Every time another filter is changed, the ‘only relevant values’ filter must be queried again to change the values that appear.

Lastly, the Performance Recorder

My final tip is to use the Performance Recorder. This tool allows you to identify which actions and processes are the most intensive, i.e. contributes to the slowness.

Help > Settings and Performance > Start Performance Recorder

After hitting the start button, use the dashboard as usual then when you’re ready, stop recording. A new workbook will open with visualisations to help you figure out what’s slow.

I hope this was helpful!

Louise 🙂

Talking Tableau

It’s 2020 and everyone is reflecting on last year and making goals for this year. I didn’t do a lot of things well in 2019; namely, blogging. Now any reason I give will be (or sound like) an excuse so I won’t bother. I hope to viz and blog more this year but I also want to do more travelling, spend more time with my loved ones, volunteer more and take time to care for my health so who knows what will happen – all I can say is I will try my very best!

Focusing on more positive moves now, one thing I think I did quite well with last year was public speaking. I gave two talks: first a Tiny Tableau Talk in June and then speaking at the London Tableau User Group Summer Sessions in August. I never wrote a blog on these talks so here goes!

Click to Read more!

My First Tableau Conference – A Diary and Tips for the next one

On October 4th 2019, I booked to attend Tableau Conference 2019 in Las Vegas. This was going to be my first Tableau conference and I was buzzing.

Since learning about Tableau and the community, I had heard grand stories about how huge the conference was, how crazy the parties were and how very American it was. And now, I would get to see it for myself.

In the run up to the conference, I read blogs on how to prepare and what to do when I get there, I also sourced advice from the Tableau Twitter community.

The tips that kept coming up:

  • Go to Devs On Stage (keynote where Tableau developers unveil new features)
  • Talk to as many people as you can – i.e. network your ass off
  • Wear comfortable shoes!

I also got recommendations for various sessions including ones by Bethany Lyons, attending hands-on workshops, Fanalytics and more.

With so much to do and limited time, I decided to set 3 simple goals only and as long as I accomplished them, I could go home feeling like I’ve gotten something out of it.

Click to keep reading!

How to Colour Scale a Map Using Set Actions!

I thought my Best of DS11 blog would be my final blog post on the Data School website but no, I have one quick blog post left. Set Actions. They’re new and exciting, right? Today at the Data School, Harry of DS11 taught us (and the coaches) set actions as he was assigned to teach the public this topic a few weeks ago. He has two blog posts on set actions which will delve much deeper than my blog post right now, check them out here and here. Andrew has also written one on proportional brushing here.

In this blog post, I will show you how to use set actions to change the colour scale of your filled maps depending on the locations you choose to lasso.


Let’s start!

Figure 1 below shows a map of Europe with sum of sales on colour (this is EU Superstore). The first step to creating this set action is to create a set. Right-click on ‘State’ which is every region or some sort of chunk within each country and click Create> Set. Select all the “states” and call the field ‘State Set’.

Fig 1. Starting map
Click to keep reading!

The Best of DS11

This week is DS11’s last week of training. Next week, we’ll all be split up and sent to our placements for the next 6 months. We probably won’t all be back together for a while so I’ve been feeling quite reflective. Throughout the past 4 months, we have done some amazing work and in this post, I would like to highlight the vizzes and blogs that are personally my favourite. DS11 has produced so much useful and incredible content over the past few months and this post can’t possibly cover it all so be sure to check out our Twitters and Tableau Public profiles.


Meet us!


Favourite Viz : One

How could I have a favourite viz section and not include this beautiful viz by Ellie. This viz was done for Dashboard Week Day 1 and deservedly got Viz of the Day! Check it out here. Isn’t the snow incredible?!

Ellie’s VOTD!
Click to keep reading!

The Prep Off: Alteryx vs Tableau Prep Round 2


Two major contenders in the ring tonight: new but developing at light speed, Tableau Prep and tried and trusted, Alteryx Designer.

Who will win this time after a draw in the last Prep Off? Watch the replay of Round 1 here.

How do these two softwares compare when cleaning an Excel spreadsheet with 182 fields? The chosen data features the table seen in Figure 1. This data was used in Makeover Monday Week 2 2019 (after it was cleaned, of course). Download the Excel file (Freedom of the Press) and follow along with me. 


Fig 1. Original Excel spreadsheet. Years go from 1979-2016


Ready? Fight!

Click to keep reading!

Why You Should Apply For The Data School

Now that DS11 are approaching the end of our 4 months of training at the Data School and will soon be shipped off to our first of 4 placements, I have been reflecting on the experience and would like to convince you to apply for the Data School too.


Because it’s an amazing opportunity

Where do I start with this one? A salary of 30k in year one, rising to 35k in year two. That alone is a reason many would want this job but it’s so much more than the pay. You will be taught for four months (paid) by the best in the business. The Information Lab is home to 4 Tableau Zen Masters and 2 Alteryx Aces as well as so many of the brightest in the community. The wealth of knowledge and experience that you will have access to is something enviable for many. The Data School is an opportunity to learn and kickstart your career. By the time your 2.5 years are up, you will have worked at 5 different companies (incl. The Information Lab) and worked with many more clients while you were in training. There is no question that you will be qualified for some amazing jobs afterwards. In fact, if you have taken advantage of the opportunities presented to you in the 2.5 years, you will likely have a choice of jobs to go to.


Click to keep reading!

Organising your Tableau Data Pane for Bliss and Harmony

Today DS11 and DS12 were treated to a talk from Simon Beaumont about data architecture, enabling customers to understand your dashboards, how to make your workbooks easy for others to pick up and more. In this post, I will go over a few things about organising your Tableau workbook Data Pane to make it easier for others to understand.


Why organise your Data Pane?

If you are working in an organisation with multiple analysts and/or people who you will hand over workbooks to, you want them to be able to understand your workbook quickly. It is better to avoid future analysts having to spend hours picking your workbook apart to understand what a calculation does or what this set is used for, etc…

Also, if you publish your work to Tableau Public, you might want to make the workbook easy to understand in case someone downloads it to learn a technique you demonstrated.

Additionally, it may help you later down the line. If you have to refer back to an old workbook and realise you don’t understand how you got to what you did, that would be a pain.

As you can see, there are numerous reasons why one should organise their Data Pane.


Click to keep reading!

How to Prepare for your Alteryx Designer Core Exam

This month, many of DS11 are taking the Alteryx Designer Core Exam (as well as the Tableau QA), including myself. If you’re interested in my top tips on how to pass the Tableau QA, see my post here.


In this post, I will go through:

  1. The resources I found helpful while preparing for the exam
  2. My experience of taking the exam
  3. My top tips for passing!


Click to keep reading!

How to Teach Tableau/Alteryx

Last month, DS11 taught the public Tableau and Alteryx and this month, we are conducting webinars teaching the same content. Check out our meetup page for more details on upcoming webinars and events!

For both of these lessons, I taught Alteryx Data Prep. If you missed my webinar, it was recorded and will be uploaded so I will update this post with a link later.

In this blog post, I will go over my teaching experience and some top tips from myself and from the beautiful people at the Information Lab.


My Teaching Experience and Top Tips!

Fig 1. DS11’s Alteryx Training Day


To prepare for teaching, I sought advice from the wealth of experience of the Information Lab consultants. The advice I received was super useful and helped me to prepare my lesson plan. Figure 2 below shows all the teaching tips I gathered categorised into four sections.


Click to keep reading!